July 20, 2017
SOI 2017 Infographics
Check out four different infographics on Markets, Products, Companies and Regional Breakdown for the Counselor State of the Industry 2017. (All files are in PDF format.)

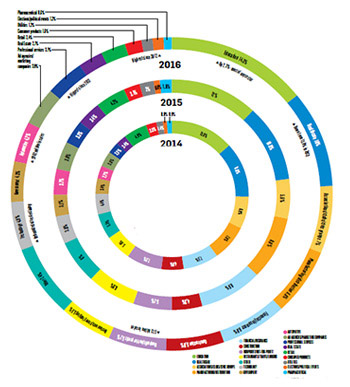
MARKET WATCH: A look at the largest end-user sectors over the last three years. The numbers show the percentage each industry contributed to total annual distributor sales.

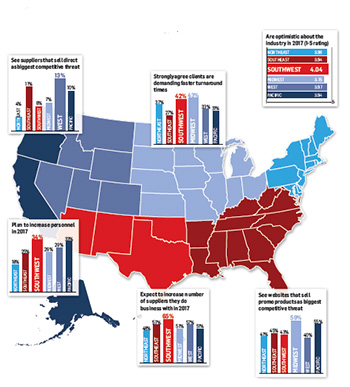
REGIONAL BREAKDOWN: A look at distributor opinions and expectations based on geography.

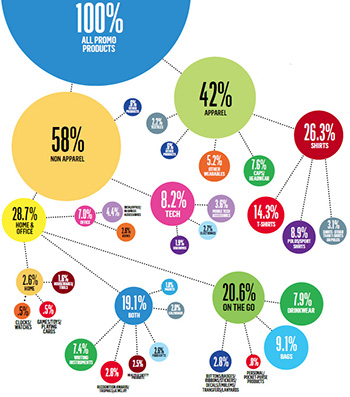
MARKET WATCH: The market share of promo items - shown as the percentage of distributor sales that each category represented in 2016.

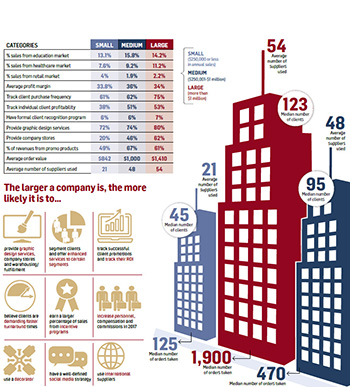
SIZING THEM UP: A comparison of distributor firms in 2016 based on their annual revenues.